Spot crossing#
We can also make a model of a spot crossing the stellar surface. Here it’s done as a spherical cap with a brightness following \(f=(T_{\rm spot}/T_{\rm eff})^4\).
The grid is created as before.
Note that like Spot also iherits from Star.
[1]:
import obscurae as obsc
Ts = 3000 #temperature of the spot in K
Rs = 0.15 #spot-to-star radius ratio
Teff = 6000 #effective temperature of the star in K
spot = obsc.Spot(Tspot=Ts, Teff=Teff, Rspot=Rs,vsini=10.,zeta=3.0,xi=2.0,cs=[0.8,0.3])
spot.Grid()
spot.Line()
/Users/emilkn/Library/CloudStorage/OneDrive-Chalmers/Desktop/postdoc/obscurae/src/obscurae/obscurae.py:337: RuntimeWarning: divide by zero encountered in divide
  tan = np.exp(-1*np.power(vel_1d/(zeta*y),2))/y
/Users/emilkn/Library/CloudStorage/OneDrive-Chalmers/Desktop/postdoc/obscurae/src/obscurae/obscurae.py:337: RuntimeWarning: invalid value encountered in divide
  tan = np.exp(-1*np.power(vel_1d/(zeta*y),2))/y
Again \((x,y)\) values in units of the stellar radii could be supplied directly, but we can also characterize the position of the spot as it being found at a colatitude, \(\phi\), and longitude, \(\theta\), moving with the rotation period of the star, \(P_{\rm rot}\).
[2]:
import numpy as np
## time/observations in days
time = np.linspace(-0.1,0.25,5)

t_ref = 0.0 #time of reference
per = 1.39 #period in days

phi = np.deg2rad(57.8)#latitude in radians
theta = np.deg2rad(213)#longitude in radians

xs, ys = obsc.SpotOn.spotPos(time,theta,phi,per,t_ref)
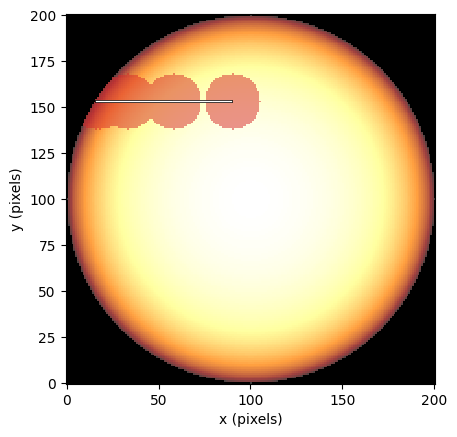
Let’s see the spot on the surface. The brightness/darkness of the patch changes with \(f\).
[3]:
spot.Cross(xs,ys)
spot.crossing(rotation=False,trace=(xs,ys)) #don't show the rotating stellar disk (as clearly)
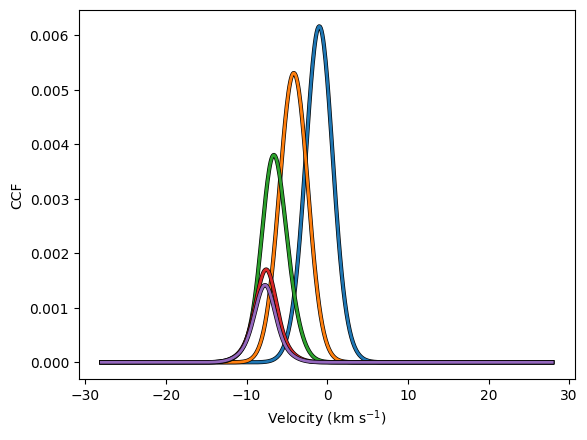
Again we’re interested in the line deformation.
[4]:
spot.distortLine()
spot.showLines()